Japan Map Color Separated Provinces Vector Guide
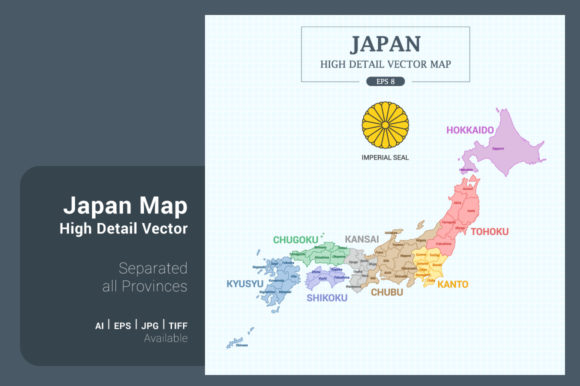
When designing content focused on Japanese geography, culture, or travel, precision is just as important as aesthetics. The Japan Map Color Separated Provinces vector illustration serves as a foundational asset for creators who need accuracy without sacrificing visual appeal. Unlike generic outlines found in basic clip-art libraries, this high-detail resource treats each of the 47 prefectures as an individual, editable object. This distinction matters significantly for professionals working on regional marketing campaigns, educational materials, or data visualization projects where specific geographic targeting is required.
The visual personality of this map strikes a balance between informational clarity and modern design sensibility. It avoids the sterile look of government survey data while maintaining enough fidelity to be trusted in professional contexts. The full-color separation allows for immediate visual hierarchy, making it easy for audiences to distinguish between regions like Kanto, Kansai, or Tohoku at a glance. For designers and marketers, this means the map functions not just as a background element, but as an active component of the user interface or editorial layout that guides attention exactly where it needs to go.
Technical Specifications for Multi-Platform Use
One of the primary challenges in modern digital and print design is maintaining quality across vastly different output sizes. This asset addresses that friction point with a square format resolution of 5000x5000 pixels. In physical dimensions, this translates to approximately 42x42 cm (or 16.5 x 16.5 inches) at standard print resolution. This generous canvas size ensures that when you are creating large-format posters, trade show banners, or detailed infographics, the edges remain crisp and the colors stay vibrant without pixelation.
For digital applications, the vector nature of the source files (.AI8 and .EPS8) provides infinite scalability. Whether you are resizing the map for a compact mobile app icon or stretching it across a widescreen presentation slide, the geometry remains mathematically perfect. The inclusion of raster formats like JPG and TIF offers immediate utility for users who may not have access to Adobe Illustrator or similar vector editing software. This versatility makes the Japan Map Color Separated Provinces asset accessible to everyone from senior art directors to small business owners managing their own social media channels.
Strategic Applications in Branding and Editorial Design
Geographic visuals often anchor brand identity for organizations with a regional focus. Travel agencies, logistics companies, and cultural institutions frequently rely on accurate cartography to establish credibility. Using a premium vector asset like this signals professionalism and attention to detail. When integrated into web design or packaging design, the separated provinces allow for interactive storytelling. Imagine a tourism website where hovering over a specific prefecture highlights it in a brand accent color; this level of interactivity is only possible because each province is a distinct layer rather than a flattened image.
In editorial design and publishing, this map supports complex narratives. Authors and layout designers can use the color separation to code information visually. For example, a report on agricultural exports could shade producing regions in green and non-producing regions in grey, creating an instant heatmap. This reduces cognitive load for the reader and transforms raw data into an engaging visual story. The square aspect ratio is particularly useful for modern layouts, fitting naturally into Instagram posts, LinkedIn carousels, and modular grid systems used in contemporary magazine design.
Customization and Visual Hierarchy
The true value of a separated vector map lies in its malleability. Because every province is an isolated path, customization goes far beyond simple recoloring. Designers can adjust stroke weights, apply gradients, add drop shadows, or even explode the map to create spacing between regions for a stylized effect. This flexibility is crucial for maintaining consistency within a broader brand identity. If your corporate palette uses specific hex codes, you can match the map exactly to your typography and UI elements, ensuring a cohesive look across all touchpoints.
Visual hierarchy is another area where this asset excels. In information design, you often need to emphasize one area while subordinating others. With a flattened raster map, this requires tedious masking and reconstruction. With this vector file, you can simply lower the opacity of non-essential provinces or desaturate them to push them into the background. This technique directs the viewer’s eye immediately to the focal point, improving readability and engagement. It is a practical application of design theory that saves hours of production time.
Evaluating Fit for Commercial and Creative Projects
Before integrating any geographic asset into a commercial project, it is essential to evaluate its suitability for your specific audience. While this Japan Map Color Separated Provinces illustration is highly versatile, consider the tone of your project. The clean, colorful aesthetic works exceptionally well for consumer-facing brands, educational platforms, and modern corporate communications. However, if you are producing a historical academic paper requiring antique cartographic styles, or a minimalist luxury brand identity that demands extreme abstraction, you may need to adapt the style or seek a specialized alternative.
Testing the asset in context is always recommended. Place the map alongside your chosen typeface—whether it is a modern sans serif for tech presentations or a traditional serif for cultural publications—to ensure the visual weight balances correctly. The map’s detail level should complement your typography, not compete with it. Additionally, verify licensing terms for your intended use case. Ensuring you have the appropriate commercial rights protects your business and respects the creator’s work, which is a fundamental aspect of professional design practice.
Practical Workflow Integration
Incorporating this map into your workflow should be seamless. For Adobe Illustrator users, opening the .AI8 or .EPS8 file reveals a structured layer panel that typically groups provinces logically. This organization is a hallmark of premium design assets and allows for rapid iteration. You can lock layers you aren't working on to prevent accidental edits, or hide specific regions to create custom cropped views. For those working in Figma, Sketch, or Canva, importing the SVG or high-resolution PNG versions maintains quality while fitting into web-first design environments.
For content creators and marketers without formal design training, the pre-colored JPG and TIF files offer a ready-to-use solution. These can be dropped directly into blog posts, video thumbnails, or slide decks without modification. Yet, even these raster versions benefit from the original high-resolution master, ensuring they look sharp on Retina displays and high-DPI screens. This dual utility makes the asset a long-term investment in your content library, ready to deploy whenever Japan-related topics arise in your editorial calendar.
Ultimately, the effectiveness of any design asset is measured by how well it solves problems. The Japan Map Color Separated Provinces vector illustration eliminates the common pitfalls of geographic design: inaccuracy, poor resolution, and lack of editability. By providing a technically robust and aesthetically pleasing foundation, it frees creatives to focus on messaging and strategy rather than redrawing coastlines. Whether you are building a comprehensive travel guide, a regional sales dashboard, or a simple social media graphic, having a reliable, professional-grade map in your toolkit ensures your final output meets the highest standards of visual communication.