Streamlining Digital Support with the Online Library Helpline Infographic
In the rapidly evolving landscape of digital education and information management, clarity is often the first casualty. Libraries, educational institutions, and corporate knowledge bases are transitioning to online platforms at an unprecedented pace, yet user confusion remains a significant barrier to adoption. When patrons struggle to navigate digital catalogs, access remote databases, or troubleshoot authentication issues, the result is increased support ticket volume and diminished trust in the system. The Online Library Helpline Infographic serves as a critical bridge between complex backend systems and end-user comprehension. By visualizing support workflows and service pathways, this tool transforms abstract technical processes into accessible, actionable guidance for adults seeking immediate solutions.
Understanding the Role of Visual Support Tools
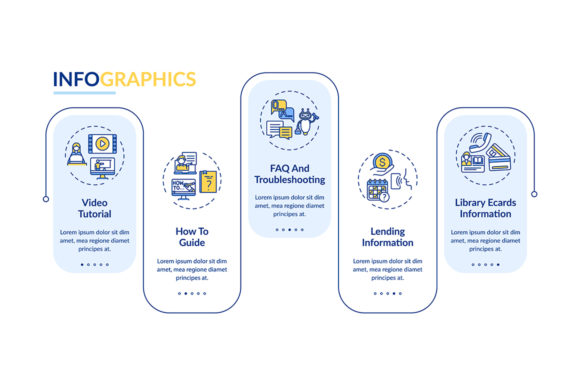
An Online Library Helpline Infographic is more than a decorative graphic; it is a functional communication asset designed to reduce cognitive load. At its core, this resource maps out the specific steps a user must take to resolve common issues or access services. Unlike dense text manuals or lengthy video tutorials, an infographic provides an immediate spatial overview of the entire support ecosystem. It typically integrates video tutorial presentation design elements directly into the static layout, using play button iconography or QR codes to link dynamic content with static reference material. This hybrid approach caters to different learning styles, allowing users to grasp the workflow visually before diving deeper into detailed instructions.
The primary goal of this visual aid is to establish autonomy. For librarians and IT administrators, the challenge is not merely providing answers but teaching users how to find them efficiently. A well-designed helpline infographic acts as a triage tool, filtering simple queries away from human staff so they can focus on complex research assistance or technical troubleshooting. It standardizes the communication of procedures, ensuring that every patron receives consistent, accurate information regardless of when or how they access the help desk.
Addressing Common Challenges in Digital Library Services
Adult learners and researchers often face specific friction points when interacting with online library systems. These challenges usually stem from fragmented information architecture. A user might know they need a journal article but lack understanding of the proxy server login process. Another might need to renew a book but cannot locate the account dashboard amidst a cluttered interface. In these situations, textual FAQs often fail because they require the user to already possess the vocabulary to search for the solution.
The Online Library Helpline Infographic addresses these gaps by focusing on intent rather than terminology. Instead of listing features, effective infographics map user journeys. They answer questions like "How do I get help?" or "What is the process for requesting an interlibrary loan?" through intuitive visual cues. This is particularly vital for non-native speakers or individuals with reading difficulties, for whom linear text can be a barrier. By utilizing universal iconography and color-coded pathways, the infographic democratizes access to support services, ensuring that technical literacy does not become a prerequisite for library usage.
Visualizing Success: The 5-Step Data Visualization Framework
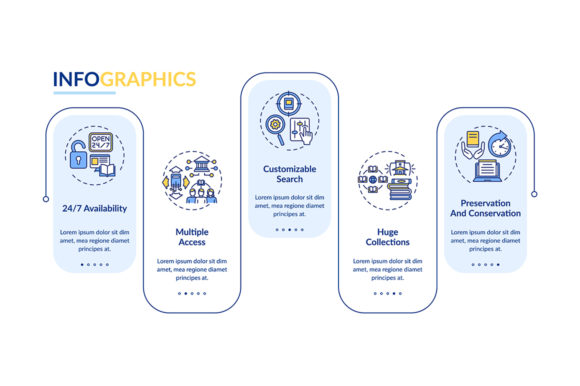
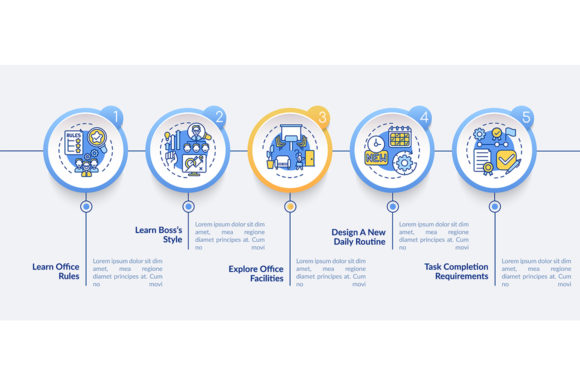
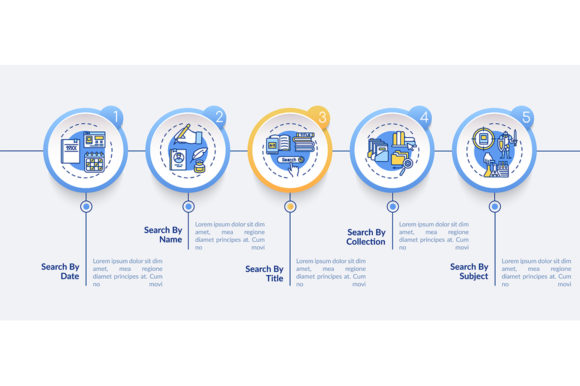
To be truly effective, support graphics must follow a logical narrative structure. The most successful templates utilize data visualization with 5 steps to break down overwhelming procedures into manageable chunks. Cognitive science suggests that working memory is limited; presenting information in groups of five or fewer items significantly improves retention and compliance. When designing or implementing an Online Library Helpline Infographic, consider structuring the content around this proven framework:
- Identification: Clearly define the problem or service category using distinct icons (e.g., a magnifying glass for search issues, a lock for access problems).
- Navigation: Show the exact path through the website or app, utilizing screenshots or simplified UI representations to ground the user.
- Action: Highlight the specific interaction required, such as clicking a button, filling a form, or scanning a code.
- Verification: Provide a visual checkpoint so the user knows they are on the right track before completing the task.
- Resolution/Escalation: Clearly display the success state or provide direct contact information if the self-service step fails.
This structured approach turns a chaotic support experience into a predictable process timeline chart. Users can instantly assess where they are in the resolution cycle and how much effort remains, which drastically reduces anxiety and abandonment rates.
Leveraging Professional Design Assets for Implementation
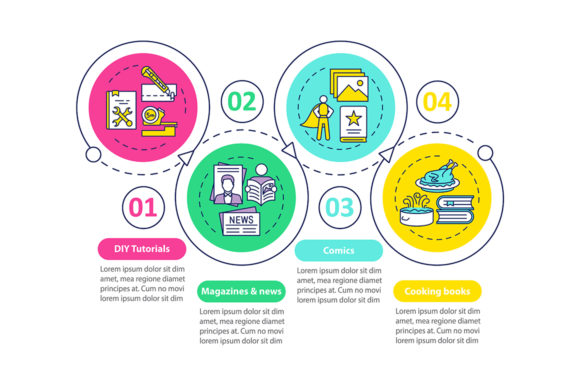
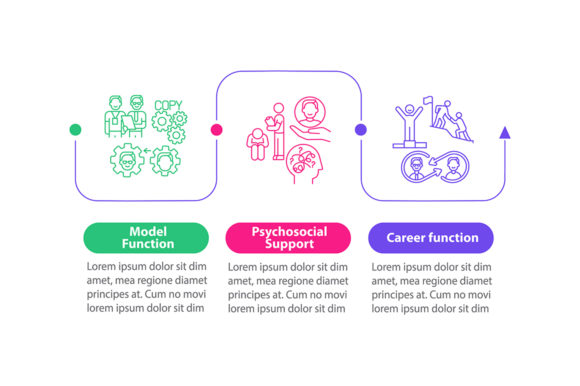
Creating high-quality visual aids from scratch is resource-intensive. This is where the Online library helpline vector infographic template becomes invaluable for library staff and instructional designers. Professional templates provide a pre-established visual hierarchy that adheres to accessibility standards and modern design principles. Crucially, these resources often come with a workflow layout with linear icons, which offers a clean, minimalist aesthetic that reduces visual noise and focuses attention on the content.
When sourcing these assets, versatility is key. A comprehensive ZIP file contains EPS, JPG, PNG, SVG, AI formats to ensure compatibility across all library touchpoints. Vector formats like EPS, SVG, and AI are essential for print materials, large-format signage, and responsive web design because they scale infinitely without losing quality. Raster formats like JPG and PNG are optimized for email newsletters, social media posts, and legacy systems. Having access to the source AI or EPS files allows librarians to customize colors to match institutional branding, update text as policies change, and swap icons to reflect specific software interfaces without needing to hire a graphic designer for every minor revision.
Practical Applications Across Different User Groups
The utility of the Online Library Helpline Infographic extends beyond a single use case. Different stakeholders interact with this tool in unique ways, and implementation strategies should reflect these diverse needs.
For Library Administrators and Staff
Staff members use the infographic as a training aid and a consistency anchor. During onboarding, new librarians can study the visual workflow to understand the expected user journey. At the service desk, it serves as a quick reference to guide patrons through verbal explanations. Administrators also use the template to audit current processes; if a step cannot be easily visualized in the 5-step framework, it may indicate that the underlying procedure is too complex and requires simplification.
For Patrons and Researchers
End-users engage with the infographic as a self-service kiosk. Placed strategically on library homepages, within mobile apps, or printed as bookmarks and posters, it provides just-in-time assistance. For adult learners returning to education after a long hiatus, this visual reassurance validates their efforts and reduces the stigma associated with asking for basic help. The inclusion of video tutorial elements allows them to pause, rewind, and learn at their own pace without feeling rushed by a live support agent.
For Instructional Designers and Marketers
These professionals utilize the vector templates to create cohesive campaigns. When launching a new database or updating a catalog system, they can rapidly adapt the existing helpline infographic to highlight new features. The availability of multiple file formats ensures that the messaging remains consistent whether it appears in a printed annual report, a digital newsletter, or an interactive touchscreen display in the lobby.
Best Practices for Maximizing Impact
To derive maximum value from an Online Library Helpline Infographic, organizations must treat it as a living document rather than a static artifact. Regular usability testing is essential; observe real users attempting to follow the infographic to solve a problem. If they hesitate or misinterpret a step, the design needs refinement. Accessibility must also be prioritized. Ensure that vector graphics include alt-text descriptions for screen readers and that color contrast ratios meet WCAG standards. Furthermore, keep the linked video tutorials synchronized with the static graphic. Nothing erodes trust faster than an infographic pointing to a video that demonstrates an outdated interface.
Ultimately, the Online Library Helpline Infographic represents a shift toward user-centric service design. By combining the scalability of vector templates, the clarity of 5-step data visualization, and the depth of multimedia integration, libraries can create support ecosystems that are as resilient and accessible as the collections they protect. Investing in these visual tools is an investment in user confidence, operational efficiency, and the long-term relevance of digital library services.