Business Process Gradient: Visualizing Workflows with Editable Vector Templates
In the world of professional communication, clarity is currency. Whether you are pitching a startup idea to investors, explaining a new compliance protocol to employees, or teaching a complex concept in a classroom, walls of text simply do not work anymore. This is where the Business Process Gradient comes into play. It is more than just a stylistic choice involving color transitions; it is a functional design framework that guides the viewer’s eye through a sequence of events, stages, or hierarchical steps. When combined with high-quality business infographic design templates, this visual approach transforms abstract procedures into digestible, engaging narratives.
For creators, marketers, and business owners, understanding how to leverage these gradient-based vector illustrations can significantly reduce production time while elevating the perceived value of your presentations. The key lies not just in having the template, but in knowing when and why to apply this specific visual style over others.
Why Gradients Matter in Process Visualization
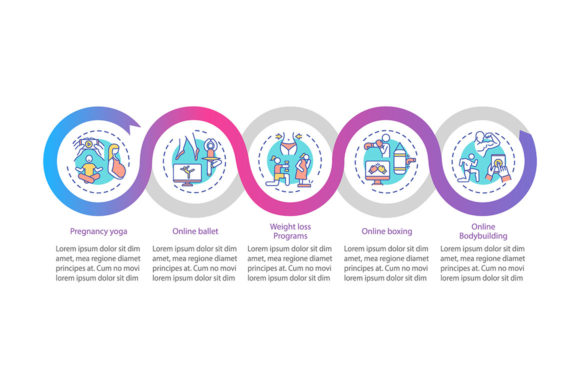
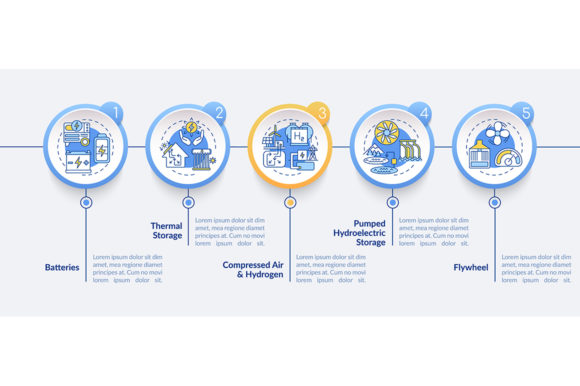
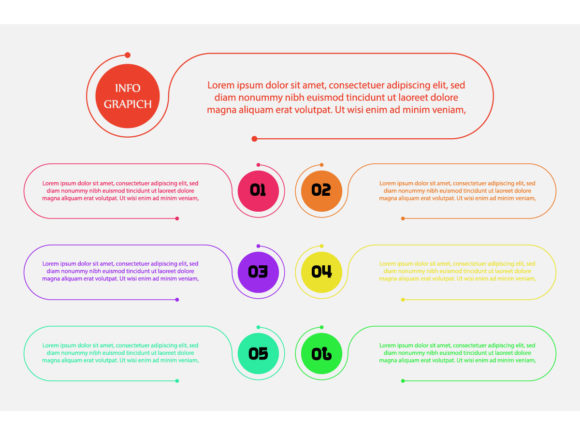
A common mistake in amateur infographic design is treating every step in a process as visually identical. While consistency is important, human brains crave progression cues. A Business Process Gradient utilizes color shifts to subconsciously signal movement, growth, or intensity. For example, transitioning from a cool blue to a vibrant orange across five distinct steps tells the viewer that the process is building toward a climax or a result without them needing to read a single word.
This technique is particularly effective because it mimics natural cognitive patterns. We associate gradients with change—sunrises, charging batteries, or heat maps. By applying this to business vectors, you create an intuitive user experience within your presentation. Editable vector infographic templates make this accessible to non-designers. Instead of manually calculating color values in Adobe Illustrator, you can utilize pre-set gradient swatches that are professionally balanced for contrast and accessibility.
Real-World Applications Across Industries
The versatility of business infographic vector illustrations means they serve vastly different audiences in unique ways. Here is how different professionals apply these tools in realistic scenarios.
Marketing and Sales Pitches
Marketers often struggle to explain multi-touch attribution models or customer journey maps without overwhelming stakeholders. A linear timeline looks flat, but a gradient-infused funnel shows conversion rates dropping or value increasing at each stage. When using an editable vector template for a sales deck, you can adjust the gradient stops to match your client’s brand colors instantly. This customization signals professionalism and attention to detail, which builds trust before you even speak.
Corporate Training and Onboarding
HR departments and trainers face the challenge of retention. New hires forget 70% of what they learn within 24 hours if it isn't reinforced visually. A Business Process Gradient is ideal for onboarding workflows because it breaks down intimidation. A "First 90 Days" roadmap designed with soft, ascending gradients feels achievable and welcoming, whereas a stark black-and-white checklist can feel bureaucratic and cold. Using outlined font files included in AI 10 and EPS 10 formats ensures that the training materials look crisp on any screen or printed handbook, regardless of whether the employee has the specific typeface installed.
Educators and Academic Presenters
For educators teaching business students or complex sciences, these templates serve as scaffolding for learning. Explaining supply chain logistics or biological cycles requires showing relationships between parts. General learning business infographic templates allow teachers to swap out generic icons for subject-specific imagery while maintaining a cohesive visual structure. The gradient helps students distinguish between phases (e.g., raw material vs. finished good) purely through color association, aiding memory recall during exams.
Freelancers and Small Business Owners
Solopreneurs rarely have the budget for custom graphic designers. When creating proposals or social media content, they need assets that look bespoke but cost little. Downloading a vector business template for presentation allows a freelancer to produce agency-quality deliverables in minutes. The ability to edit vectors means the same base file can be repurposed: use the horizontal version for a LinkedIn carousel and rearrange the elements vertically for an Instagram Story. This efficiency is critical for those wearing multiple hats.
Technical Considerations Before You Download
Not all vector files are created equal. If you are considering acquiring a Business Process Gradient template, there are specific technical factors to evaluate to ensure the asset actually serves your needs rather than becoming digital clutter.
- File Compatibility: Ensure the package includes both AI 10 and EPS 10 formats. While newer software supports advanced effects, EPS 10 remains the industry standard for cross-platform compatibility. This ensures you can open the file in older versions of Illustrator, CorelDRAW, or Affinity Designer without losing editable properties.
- Outlined Fonts vs. Live Text: High-quality templates include outlined fonts to preserve the design's integrity upon opening. However, for practical business use, you must verify that the text layers are either easily re-typable or that the original font files are linked/included. Outlined text is great for final output, but frustrating if you need to change "Q3 Revenue" to "Q4 Forecast" and cannot select the text box.
- Gradient Mesh vs. Linear Fills: Check the complexity of the gradient. Simple linear or radial gradients are easy to edit and recolor. Complex mesh gradients look stunning but can be a nightmare to modify if you aren't an advanced Illustrator user. Choose templates that balance aesthetic appeal with editability.
- Scalability for Print and Digital: Since these are vector illustrations, they should scale infinitely. Test the template by zooming in to 800%. If edges pixelate or gradients band, the file may contain rasterized elements disguised as vectors. True vector business templates remain sharp whether projected on a 4K monitor or printed on a large-format banner.
Customizing for Authenticity
A significant risk when using general learning business infographic templates is producing content that looks generic. To avoid this, treat the template as a skeleton, not the final body. The Business Process Gradient provides the structure, but your specific data and iconography provide the soul.
Consider adjusting the gradient direction to match your narrative flow. Does your process go left-to-right, bottom-to-top, or circular? Most editable vector infographic templates allow you to rotate the entire gradient group. Aligning the visual momentum with your verbal narrative creates a seamless presentation experience. Furthermore, replace stock icons with custom illustrations or screenshots of your actual product whenever possible. This grounds the abstract gradient in tangible reality.
Making the Right Choice for Your Project
Before integrating a Business Process Gradient into your next project, ask yourself what emotion or reaction you want to elicit. If you need to convey stability and tradition, a subtle, low-contrast gradient in navy or slate is appropriate. If you are launching an innovative tech product, a high-contrast neon gradient might better communicate disruption and energy.
Ultimately, the value of these design elements lies in their ability to save time while enhancing communication. For the entrepreneur rushing to finalize a pitch deck at midnight, the marketer needing consistent branding across ten different assets, or the teacher trying to make economics exciting, these tools bridge the gap between intent and execution. By selecting fully editable, properly formatted vector files, you invest in a reusable asset library that adapts to your evolving business needs, ensuring your visual communication remains as dynamic as your processes themselves.